Acoustic design application of MEMS microphone
Introduction: MEMS microphones featuring high performance and small size are especially suitable for consumer electronics such as tablets, notebooks, and smartphones. However, the microphone sound holes of these products are usually hidden inside the product, so the device manufacturer must design a sound path between the outside and the microphone to transmit the sound signal to the MEMS microphone diaphragm. The design of this sound path has a large impact on the overall performance of the system.
The picture below shows the microphone sound path of a typical tablet:
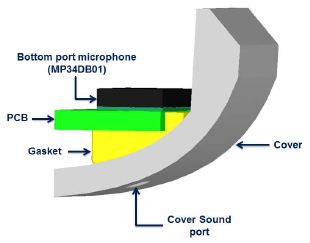
Figure 1 – Typical Application Example
The sound path between the outside and the microphone diaphragm consists of a product housing, an acoustic seal, a printed circuit board, and a microphone. This sound path acts as a waveguide to build the overall frequency response of the system. In addition, the acoustic impedance of the sound path material also affects the frequency response. If you want to accurately predict the performance of acoustic design, you need to establish a sound path model, using COMSOL and other professional-level simulation tools to simulate the frequency response characteristics of the sound path. However, this article provides the reader with some basic principles for optimizing the microphone sound path.
Helmholtz resonance
The structure formed by the narrow sound hole connected to the hollow chamber generates acoustic resonance when excited by sound waves. This resonance occurs when we blow air over the mouth of the empty bottle. This structure is called the Helmholtz resonator and is named after the inventor of the phenomenon, Hermann von Helmholtz. Helmholtz uses resonators with different resonant frequencies to identify frequency components in complex sounds such as music.
The center frequency of the Helmholtz resonance is determined by the following program:
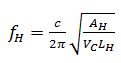
Where c is the air velocity; A H is the cross-sectional area of ​​the sound hole; L H is the length of the sound hole; V C is the volume of the cavity. The equation assumes that the resonator is a simple structure consisting of a cavity connected to a pipe of equal cross-section. If the cross-sectional area and material of the sound path of the microphone are different, the equation describing the acoustic characteristics of the sound path is much more complicated. Therefore, acoustic simulation experiments must be performed on the entire sound path to accurately predict the overall performance of the acoustic design.
In this paper, we have performed frequency response simulation experiments on different sound paths by changing the thickness and inner diameter of the microphone seal, the sound hole diameter of the product casing, the sound hole diameter of the printed circuit board, the sound path bend and the acoustic impedance of the path material. . The experimental results allow the designer to grasp in advance the extent to which these parameter changes affect the overall performance of the sound path.
Microphone frequency response
The low frequency response of the MEMS microphone is determined by the following main parameters: the size of the venting hole between the front and rear sides of the sensor diaphragm; the volume of the rear chamber. The high frequency response of the MEMS microphone is determined by the Helmholtz resonance generated by the microphone front chamber and the sound hole.
For most MEMS microphones, when the sensitivity of the microphone drops to a low frequency and then rises to a high frequency, the frequency response curve is roughly the same due to Helmholtz resonance. However, different MEMS microphones vary greatly in sensor design, package size, and construction, so the overall frequency response, especially the high frequency response, varies widely. Most of ST's microphones place sensors directly on the sound hole to minimize front chamber volume and ensure excellent high frequency response.
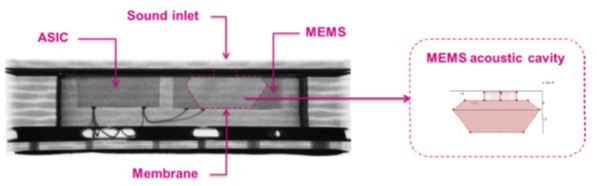
Figure 2 – X-ray image of the sound hole microphone and its sound chamber on the STMicroelectronics MP34DT01
The following simulation results describe the frequency response of the STMicroelectronics MP34DB01 MEMS microphone itself. The simulation tool solves the equation at each discrete point of the sound path model. After the simulation is finished, the data collected at all useful points is drawn. Graphics.
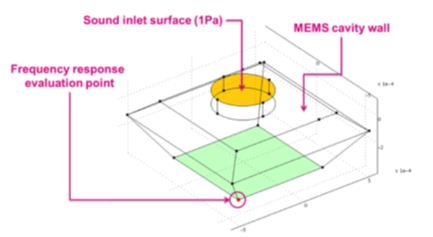
Figure 3 – Sound chamber of the MP34DB01 and MP34DT01 MEMS microphones
The MP34DB01 microphone simulation results show that the frequency response curve is very flat in the high frequency part, and the typical sensitivity rise is about +3 dB at 20 kHz because the center frequency of the Helmholtz resonance is very high. The simulation results are very close to the actual measured frequency response of the MP34DB01.
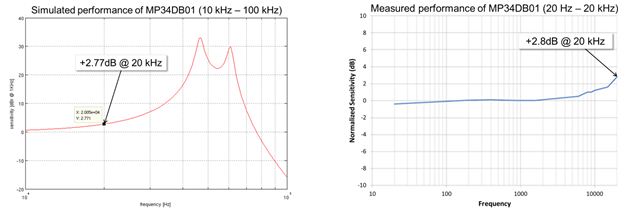
Figure 4 – MP34DB01 MEMS microphone frequency response simulation results and actual measurement results
The effect of seal thickness on frequency response
The microphone seal acts as a gas tight seal between the microphone sound hole and the product housing sound hole. After installing a microphone seal, the length of the sound hole to the front chamber of the microphone is extended, causing a change in the frequency response. The following simulation experiment is to place a circular tube of different length but fixed in diameter (400 μm) on the sound hole of the microphone to evaluate the influence of the thickness of the sealing ring on the frequency response.
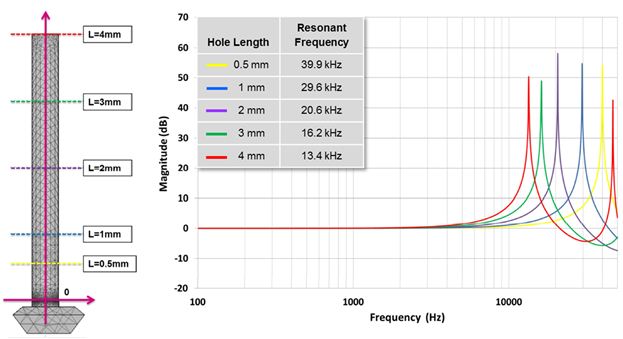
Figure 5 – MP34DT01 frequency response and seal thickness
It is not difficult to see from the simulation experiment that adding a sealing ring will destroy the frequency response performance. After the sealing ring is added (if a lower sound hole microphone is added, a printed circuit board is added), the actual sound hole length is lengthened, resulting in a decrease in the resonance frequency and an increase in the sensitivity of the high frequency portion. A thicker seal will increase the length of the resonator neck, resulting in lower resonant frequencies and worse high frequency response.
The effect of the inner diameter of the seal on the frequency response
The next simulation experiment was to evaluate the effect of seals with different inner diameters but fixed thickness (2 mm) on frequency response. Figure 6 shows the results of simulation experiments using different inner diameter seals.
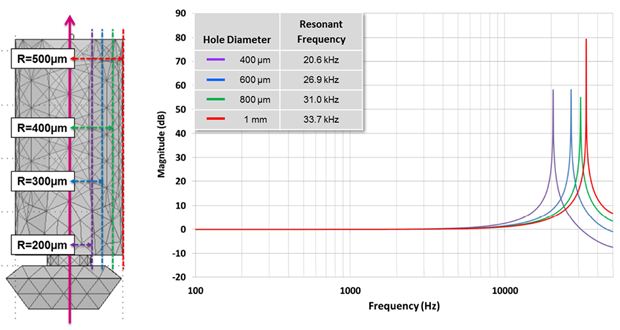
Figure 6 – MP34DT01 frequency response and seal ring diameter
These simulation data show that increasing the inner diameter of the microphone seal increases the resonant frequency and improves the overall frequency response performance.
The effect of sound path shape on frequency response
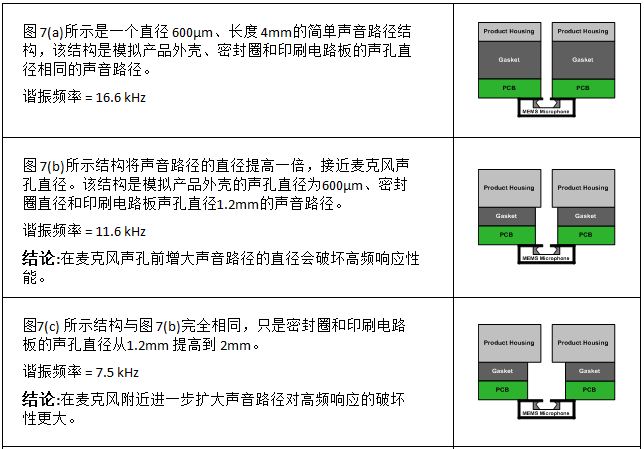
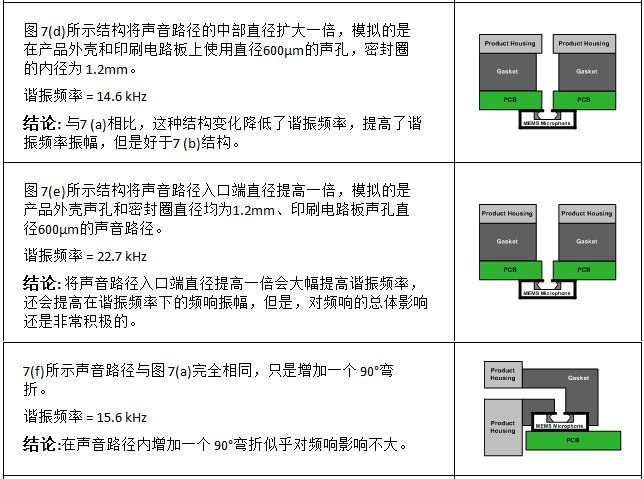
At this point, the simulation results are consistent with the prediction results obtained by solving the Helmholtz resonance equation. The following simulation experiment discusses the effect of sound path shape changes on the frequency response. This prediction is very difficult. The structure shown in Fig. 7(a) is a simple sound path with a length of 4 mm and a diameter of 600 μm. Other simulation experiments are based on this simple structure. In order to simulate changes in the width and shape of the seal ring, the sound hole of the product casing, and the sound hole of the printed circuit board, the simulation experiment added cavities with different lengths, radii, and shapes, and the sound path became very complicated.
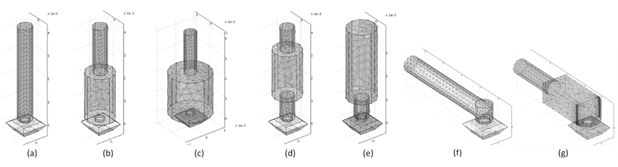
Figure 7 – Sound path shape change
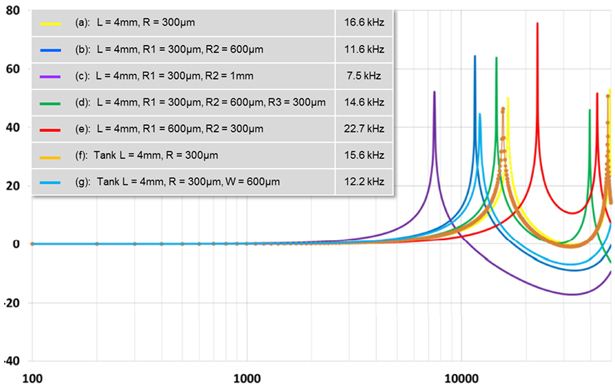
Figure 8 – Frequency response of MP34DB01 in different sound path shapes

The effect of seal material on frequency response
All of the simulations done so far have focused on the effect of the shape of the sound path on the frequency response and applied soft hard boundary conditions on all path surfaces. The following simulation experiment discusses the effect of the acoustic impedance of the seal on the frequency response. As shown in Fig. 9, in this experiment, a suitable acoustic impedance is applied to the surface of the sound hole (yellow), the sensor cavity (powder), and the sensor diaphragm (green), and the acoustic impedance of the blue surface is varied. The acoustic impedance of a material is the product of the density of the material and the speed of sound passing through the material (Z = Ï·c). Seals are usually made of rubber or other resilient materials, while typical product shells are usually made of plastic, aluminum or steel.
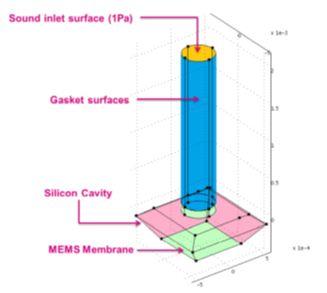
Figure 9 – Sound path surface
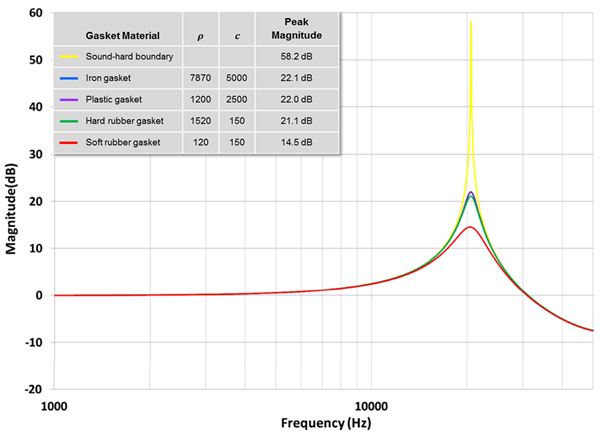
Figure 10 – Effect of seal material on resonance peak amplitude
Since the resonant frequency is determined by the shape of the sound path, although changing the acoustic impedance of the seal does not affect the resonant frequency, it affects the resonant Q value. Although the sound path remains continuously resonant, a softer seal can attenuate resonance and reduce its effect near the resonant frequency. Compared with the experimental results using acoustic hard boundary conditions, the acoustic holes using the iron surface material greatly reduce the peak amplitude of the frequency response, which indicates that the severity of the test results obtained using the acoustic hard boundary conditions is impractical.
Case Study – Analyze the entire sound path of the sound hole microphone under the tablet
Figure 11 shows the sound path of the lower sound hole microphone of a tablet. In this example, the lower sound hole mic is mounted on a printed circuit board, and a hermetic soft rubber seal is inserted between the printed circuit board and the product housing.
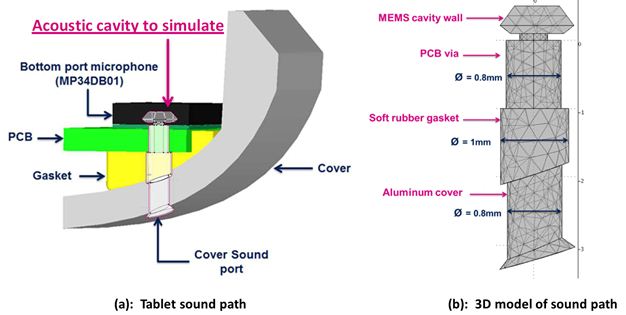
Figure 11 – Sound path design and acoustic cavity 3D model of a flatbed microphone
This simulation experiment sets the appropriate acoustic characteristics for all components of the sound path. Figure 11(b) shows the sound path 3D model of the 11(a) structure. All materials in this simulation experiment are commonly used in consumer electronics: FR4 printed circuit board, soft rubber sealing ring, aluminum body.
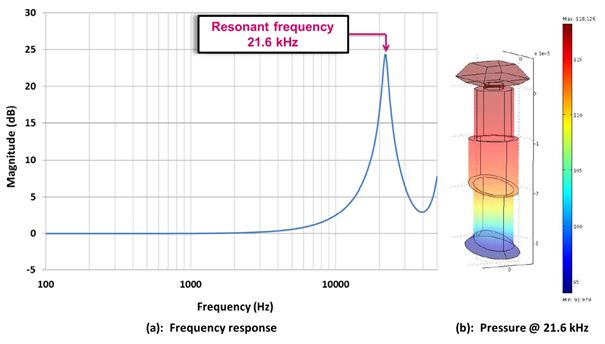
Figure 12 – Flat-panel sound path simulation results
Figure 12(a) shows the frequency response of the sound path with a resonant peak frequency of approximately 21.6 kHz, and Figure 12(b) shows the distribution of air pressure over the sound path at a resonant frequency of 21.6 kHz. At this resonant frequency, the MEMS diaphragm is subjected to the highest air pressure.
in conclusion
The following guidelines help optimize the frequency response of the microphone sound path.
â— The sound path should be the shortest and widest. Widening the outer entrance of the sound path helps to improve the frequency response, while widening the microphone end of the sound path reduces the frequency response.
â— Try not to let any cavities in the sound path. If it is unavoidable, try to keep the cavity away from the microphone sound hole.
â— The sound path curvature seems to have little effect on the frequency response.
â— The soft sealing material can weaken the resonance and improve the frequency response performance.
Electric Feet Warmers,Electronic Foot Warmers,Electric Feet Warmers Like Shoes,Heating pad for foot pain,Electric Foot warmer for bed
Ningbo Sinco Industrial & Trading Co., Ltd. , https://www.newsinco.com